The Airbase Annual Survey Of Finance Professionals
A benchmark report on findings, insights, and 2021 projections.
01 
About this report.
At Airbase, it’s our mission to help make finance and accounting teams more effective, more efficient, and, ultimately, more valuable to their companies. Understanding the environment and trends that affect these teams, therefore, is paramount for us as a company.
To that end, we used an independent research firm to collect data from small and midsize businesses (50 to 1,000 employees) in a broad survey. This report summarizes the data and offers insights from our findings. We believe that it has value for finance teams to benchmark their practices and plans against their peers, and we are pleased to share it.
Executive summary.
In spite of the proliferation of accounting automation tools, the data show finance professionals continue to rely on repetitive manual tasks to successfully manage their finance operations.
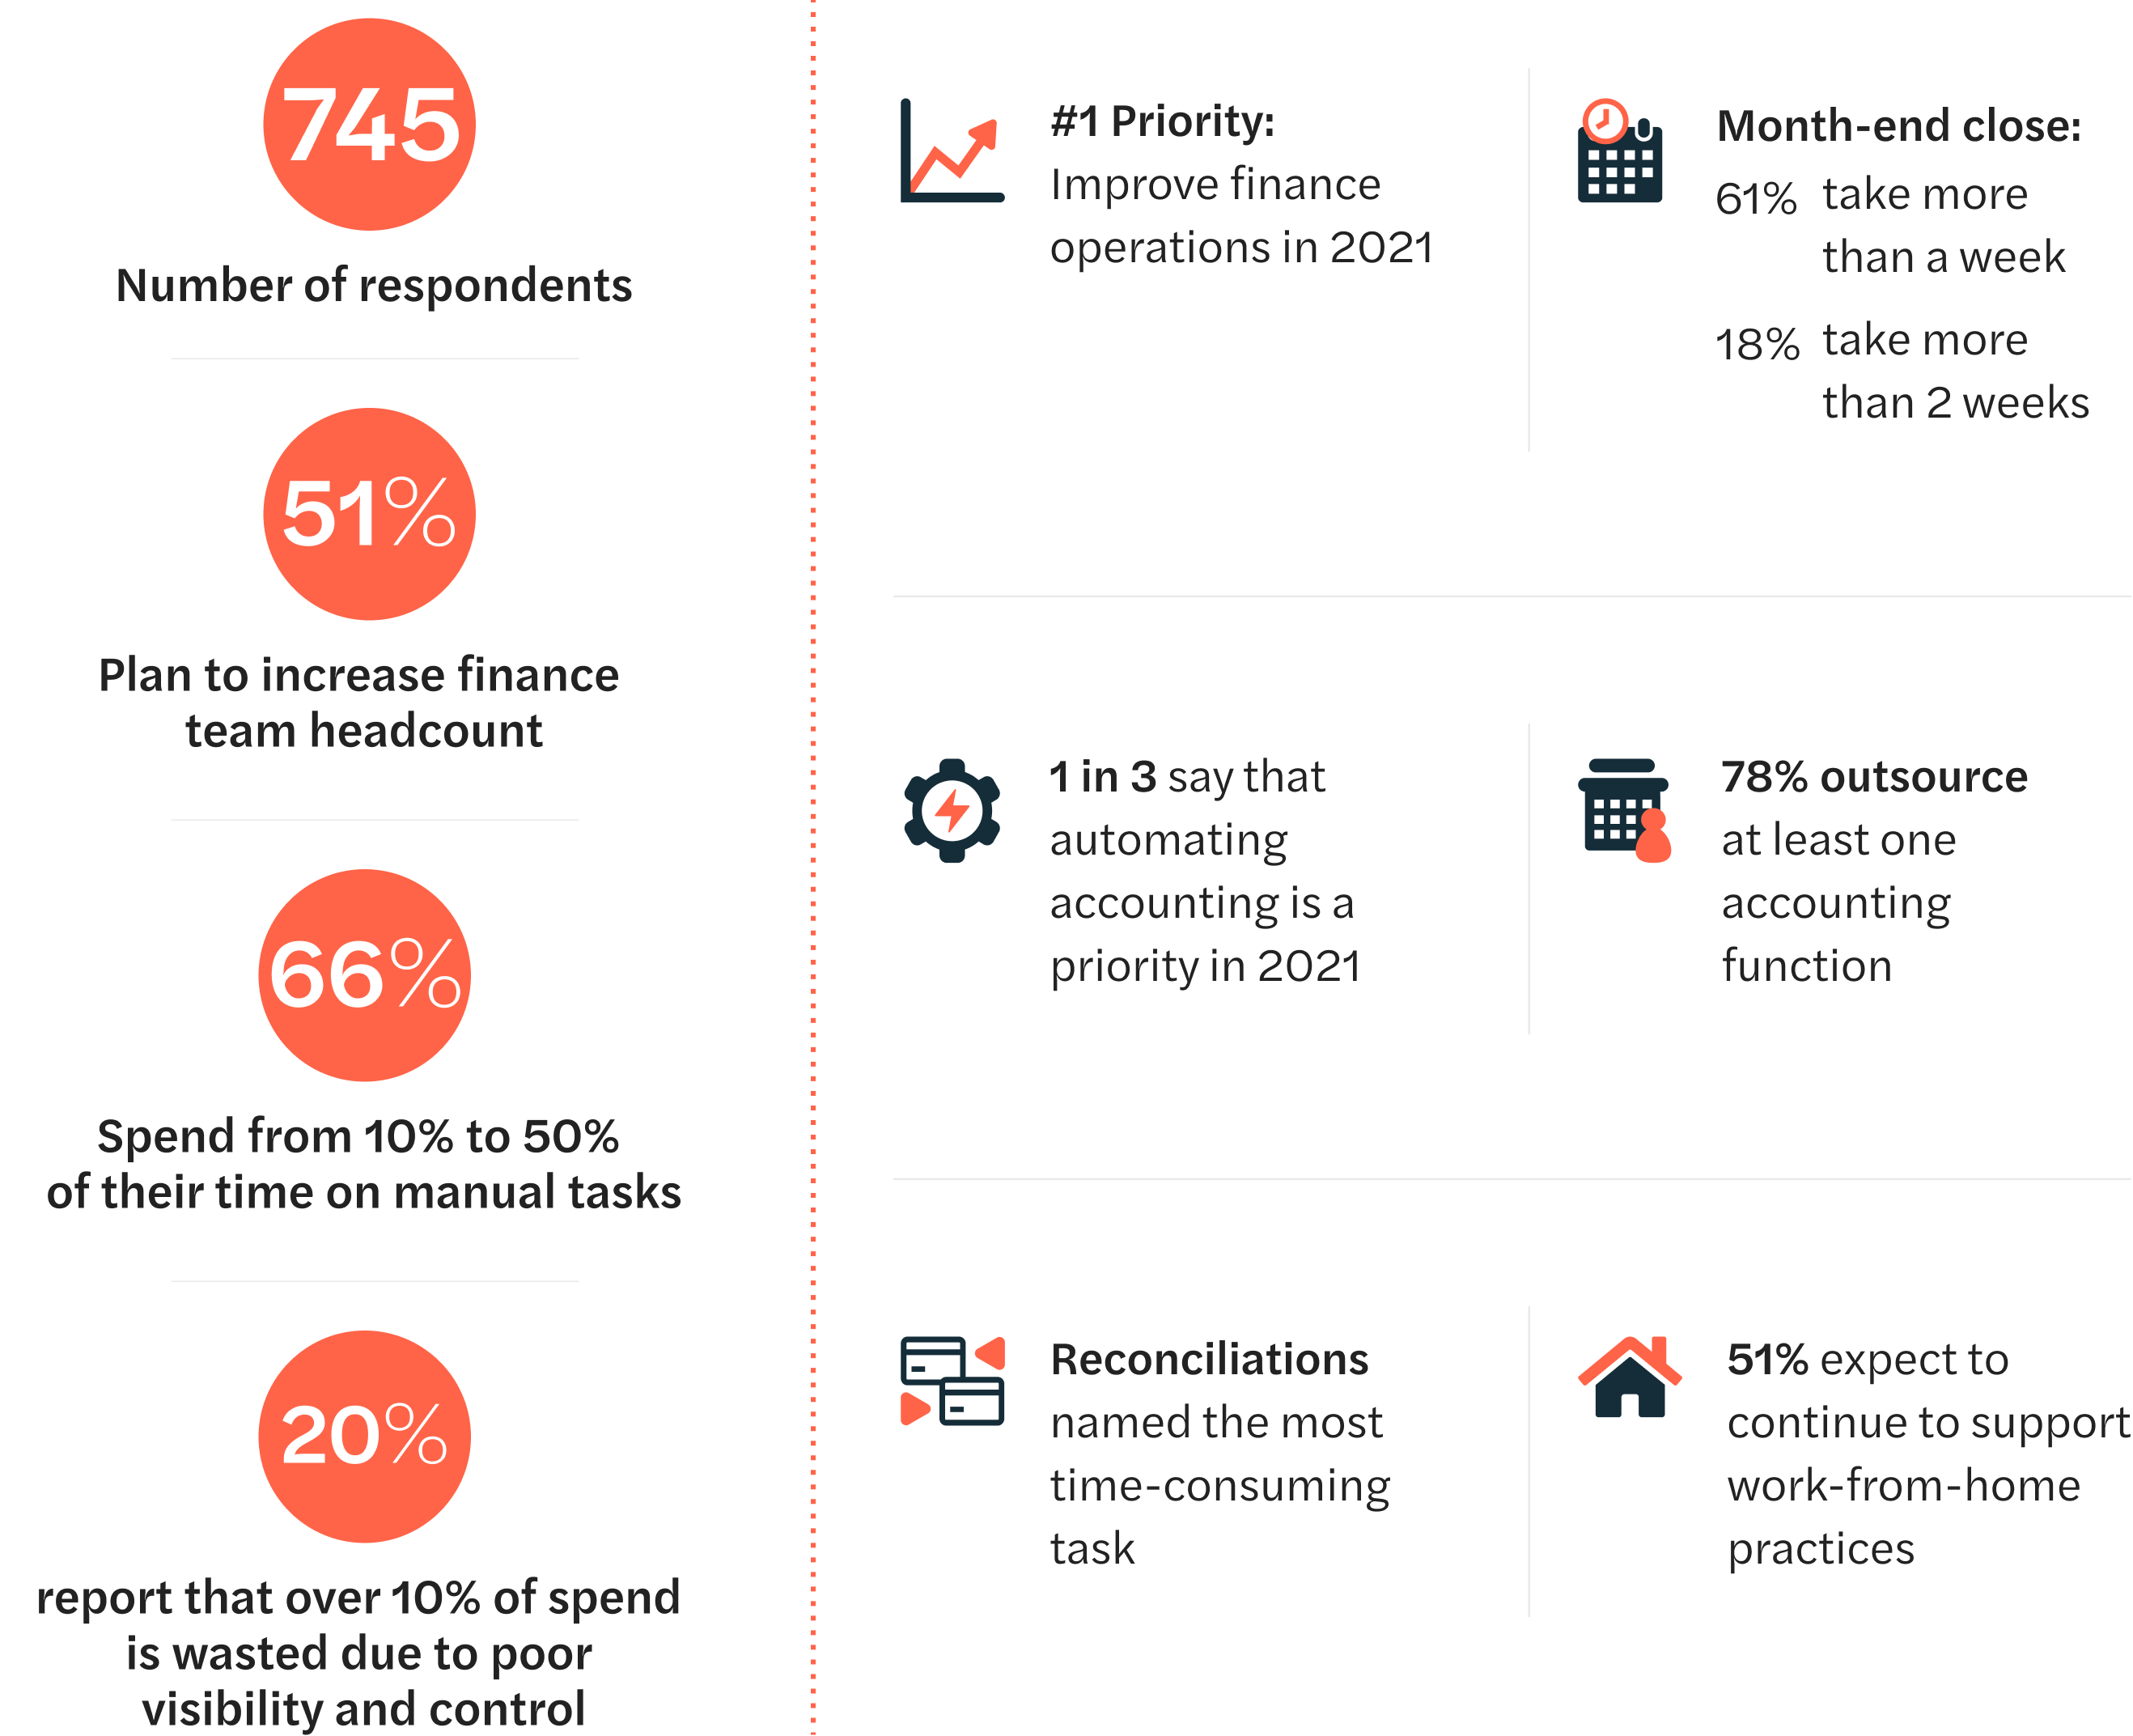
Indeed, 38% of our respondents’ teams spend more than a quarter of their time on manual tasks, and 11% report that more than half of their team’s time is consumed by them. Given the professional qualifications and generally high level of education among accounting and finance teams, freeing the time of these professionals from low-value work can have a significant impact on company productivity. It is not surprising, then, that our respondents’ number one priority is to “improve or change finance operations by adding new systems or processes.”
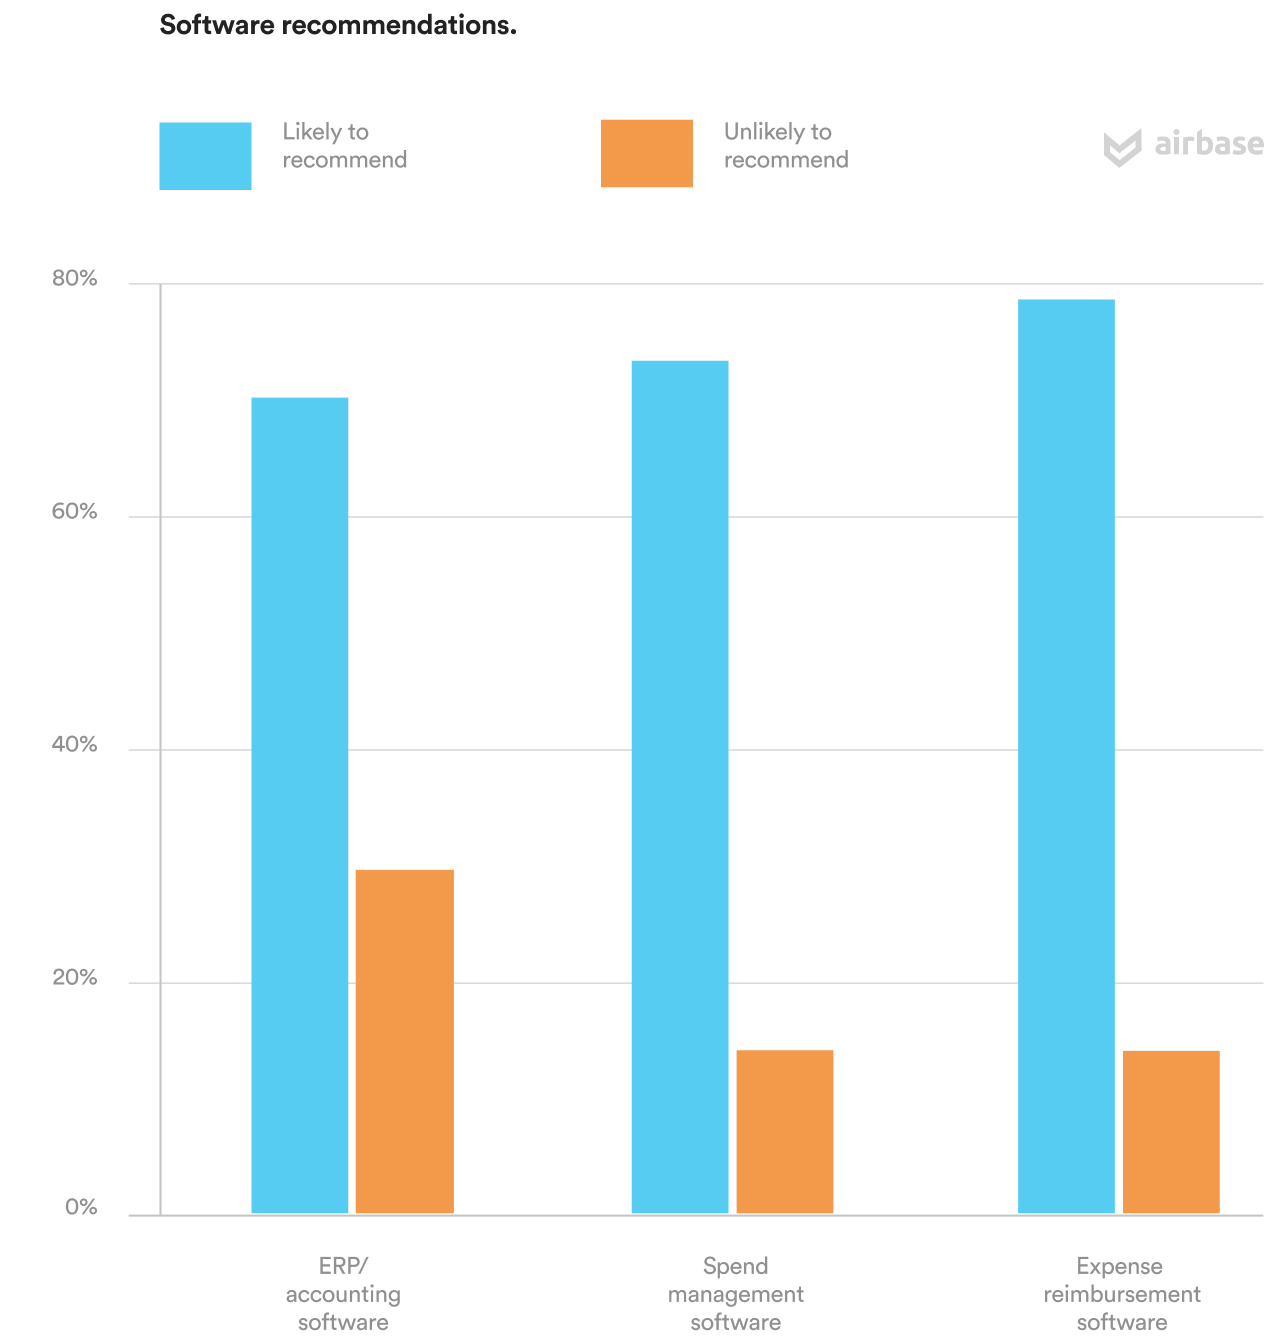
Simultaneously, those surveyed also reported high degrees of satisfaction with the software tools that they currently use. This suggests that there is not necessarily opposition to new technologies; rather, the long transition toward automation will continue as new, better tools replace remaining manual processes and accounting work.
In this report you’ll find:
-
Business benchmarks for small and midsize, predominantly venture-backed, companies and their finance and accounting teams.
-
Forward-looking data derived from responses regarding the next twelve months.
-
A review of the various accounting tools used and where manual work requirements persist.
Methodology.
The data contained in this report come from 745 respondents. Their answers were collected in November and December 2020 with the help of an independent market research firm that screened for the following:
-
All of the respondents work in a finance or accounting capacity.
-
All are employed at the manager level or above.
-
All work in the U.S.
-
All work for companies with between 50 and 1,000 total employees.
With the new tools coming out now, things can be automated more efficiently. And this frees up time for more analysis, more of the fun stuff, moving forward.*
*Airbase hosts a regular speaker series called The Path to Becoming a CFO. Quotes in this guide are from those sessions — we invite you to read more in our ebook, The 21st-Century CFO.
02 
Benchmarks for finance and accounting teams.
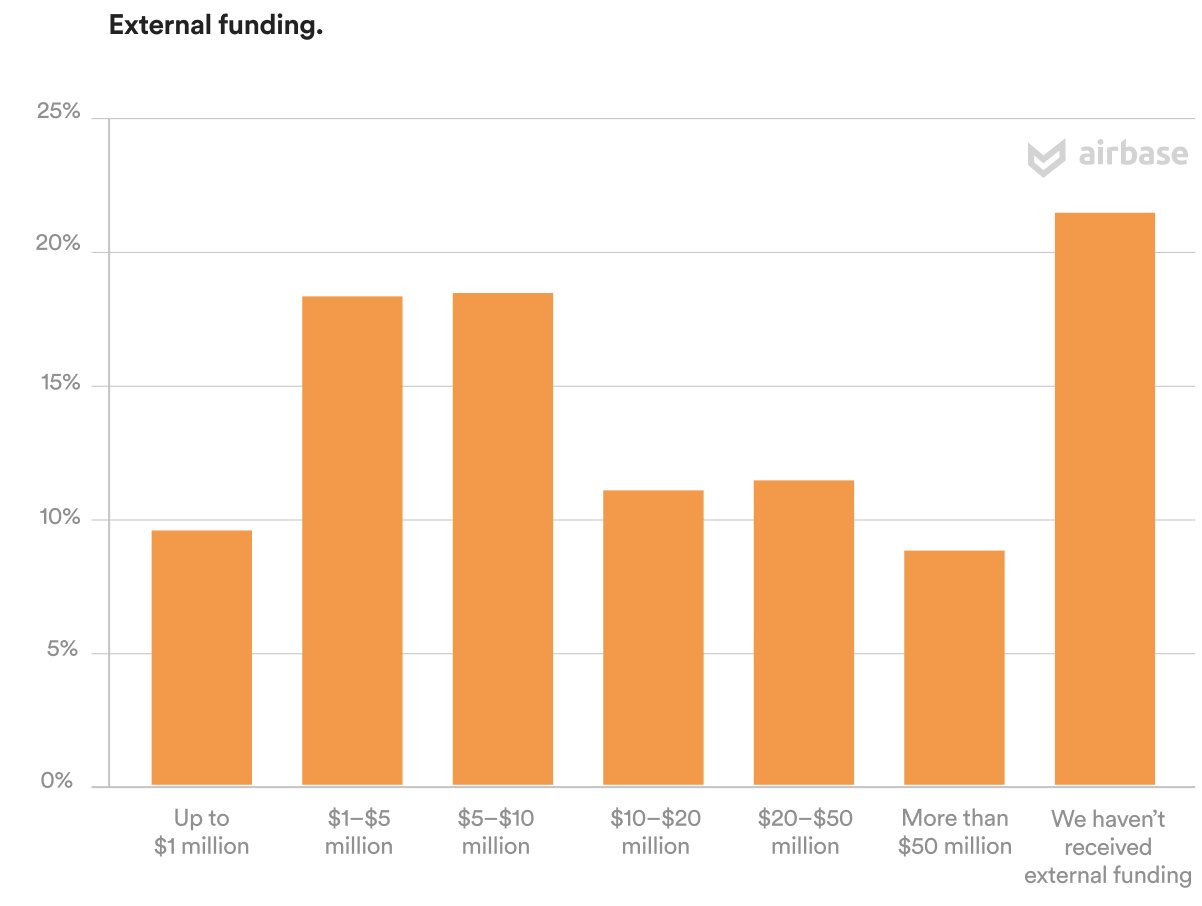
Respondents represented accounting and finance professionals from a wide range of company sizes, stages of growth, and headcount.
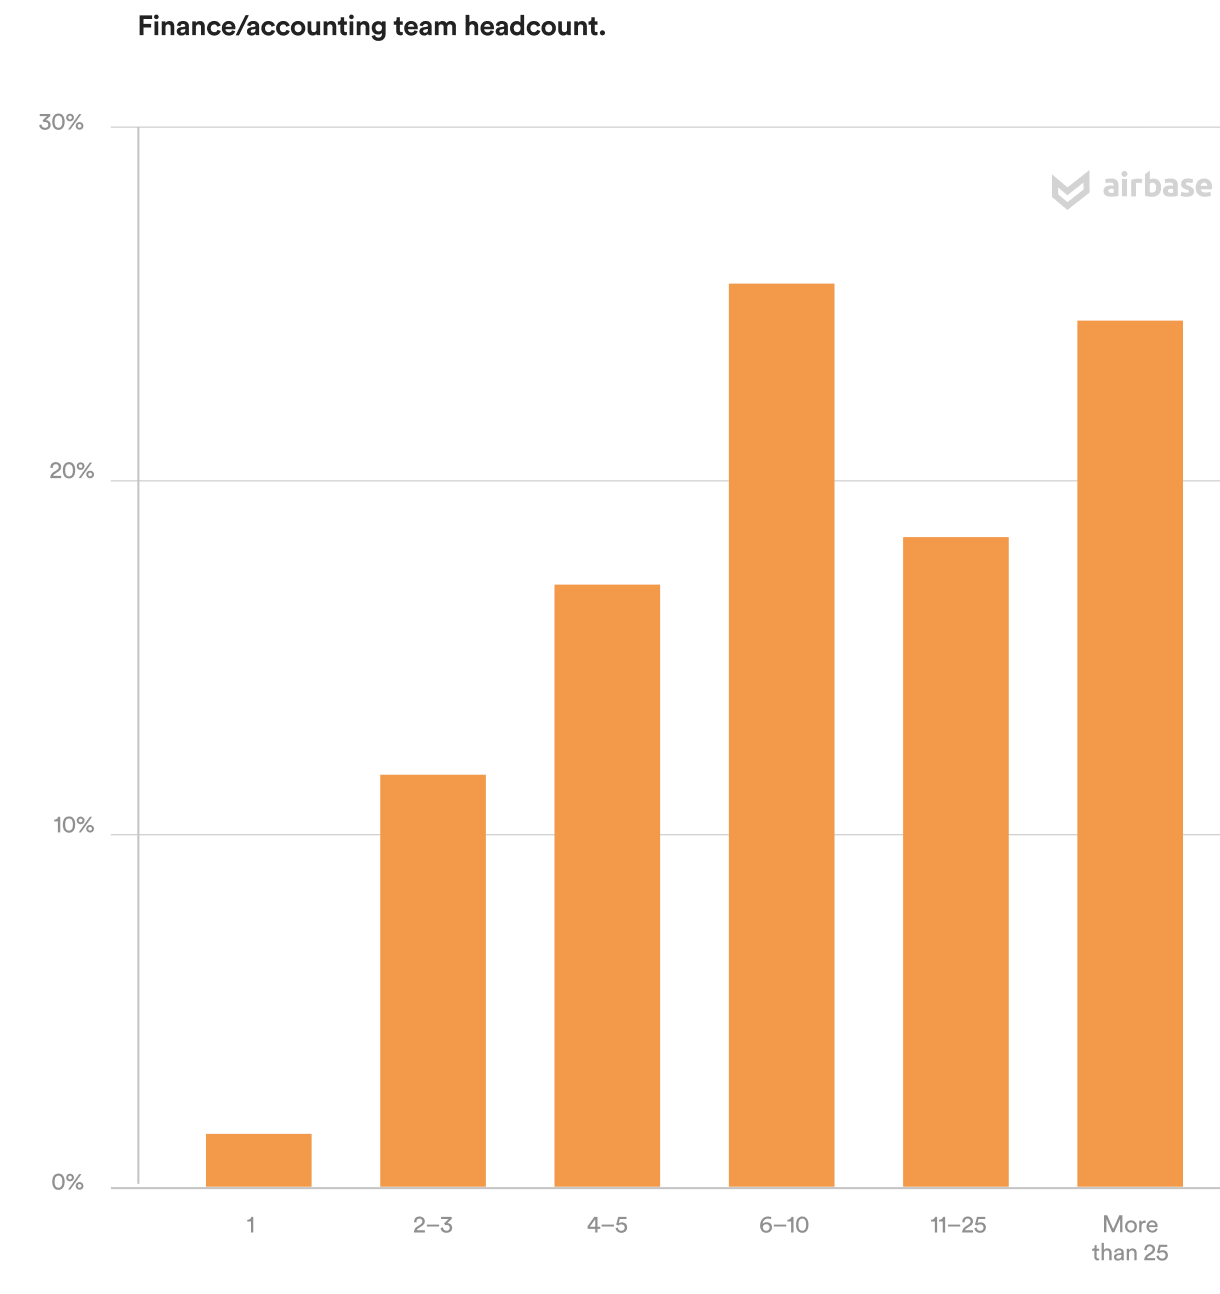
We’ve put together the following benchmarks from our collected data. The survey inquired about certain parameters, such as team headcount, to establish relevant cohorts against which others can benchmark.
For the purposes of this report, and ease of articulation, we label companies with 50–100 employees as low headcount, those with 101–500 employees as mid headcount, and those with 501–1,000 as high headcount. Nearly half of our sample worked for mid headcount companies.
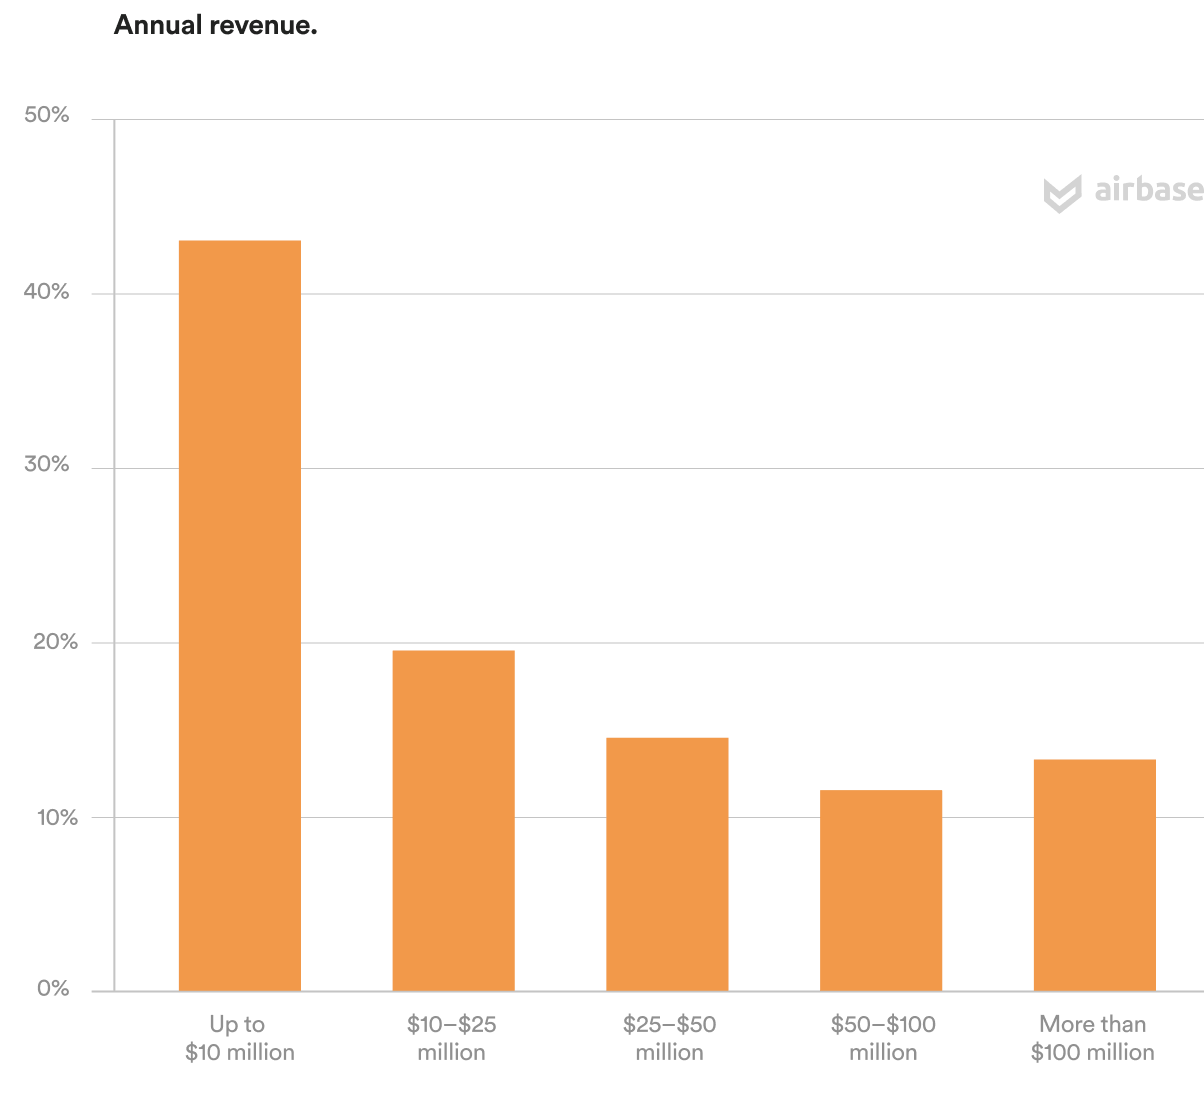
We also segmented out respondents by their company’s range of annual revenue.
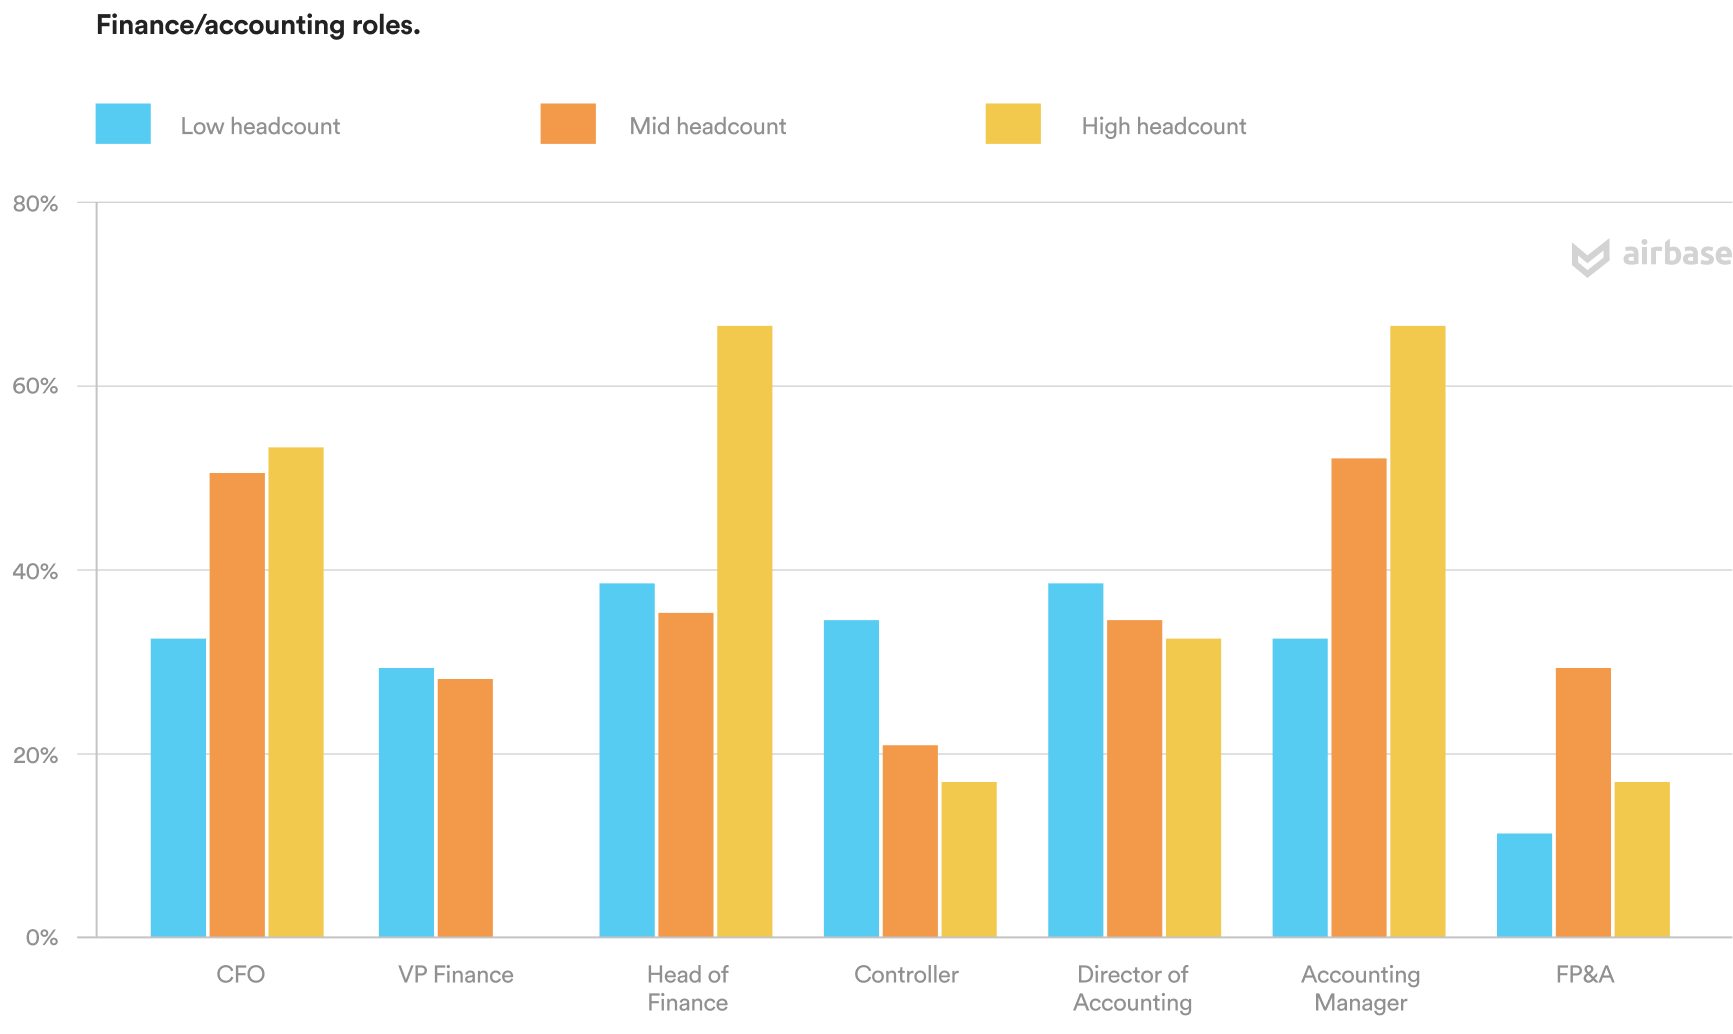
The divide between low headcount companies and their counterparts widens when looking at the roles that firms have filled. We found that three in four low headcount companies (77%) are without CFOs, compared to about half of mid and high headcount companies. We also found that the CFO gender divide exists across all company sizes, with male CFOs about three times as common as female CFOs (68% of respondents reporting a male CFO and 23% reporting a female CFO).
Almost three-quarters (71%) of those surveyed indicated that their companies have an internal FP&A team, with an additional 8% indicating future intention to have one. Only half of low headcount companies have an FP&A team.
Revenue.
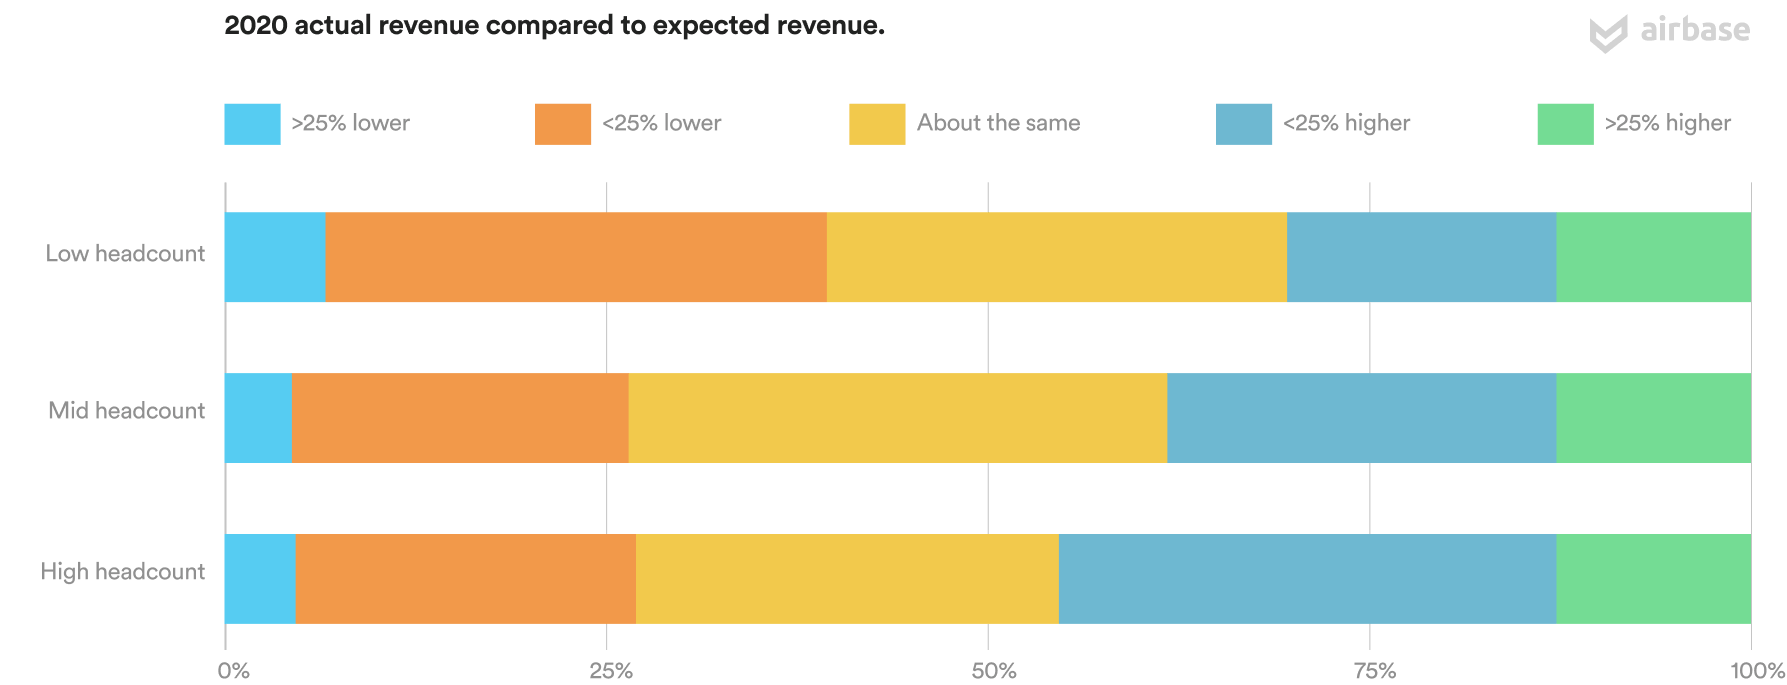
One of the most encouraging discoveries from this research is just how well companies met the adversity of 2020. About three in four (71%) reported that they expect to meet or exceed their revenue targets for the year.
The data show that this trend appears fairly consistently across all company sizes, with reports of those that managed to meet their 2020 goals ranging between 28% and 36%.
Not all fared well, though, with roughly two in five respondents from low headcount companies reporting lower-than-expected revenue for 2020, compared to about only a quarter of respondents from mid and high headcount companies.
Headcount.
Strong performance has fostered plans for growth in 2021.
Our data show that anticipated revenue growth runs parallel to increases in hiring, with about half (54%) of respondents indicating that their companies plan to increase headcount in 2021.
Roughly two in three (68%) respondents from companies that exceeded their revenue targets intend to increase headcount, suggesting that they expect the momentum to continue into 2021. Of the minority (29%) that reported lower than expected revenue for 2020, about a quarter (26%) expect to reduce headcount.
Planned headcount increases for finance and accounting teams also tracked alongside revenue performance, with roughly three in four respondents from companies that beat their revenue targets expecting to increase finance team headcount in 2021.
Small and midsize companies need well-designed tools built for their infrastructure and their needs. The capacity of finance teams can then expand while freeing these critical resources for higher value work.
Remote working.
Finance teams report adapting well to working remotely and expect it to continue.
The rapid shift to remote working seems to have become an acceptable new normal, with only about one quarter (24%) expecting to fully return to a traditional office after the stay-at-home restrictions are lifted, and only 7% reporting that their teams “have not adapted well to a remote work environment.”
This trend is comparable across all company size categories, although low headcount companies are currently more than twice as likely as high headcount companies to work in a traditional office. It should also be noted that only 6% of companies supported remote work teams pre-pandemic, whereas more than half (51%) expect to support remote work in some capacity going forward.
Concurrent with the rise of remote work, companies are already considering adjusting salaries should employees move to an area with a different cost of living. Almost two in three respondents’ companies (62%) intend to adjust salaries based on location, roughly three in four (77%) high headcount companies.
03 
2021 priorities for finance operations.
Improving operations is paramount for respondents, whether that be through new tech or new processes.
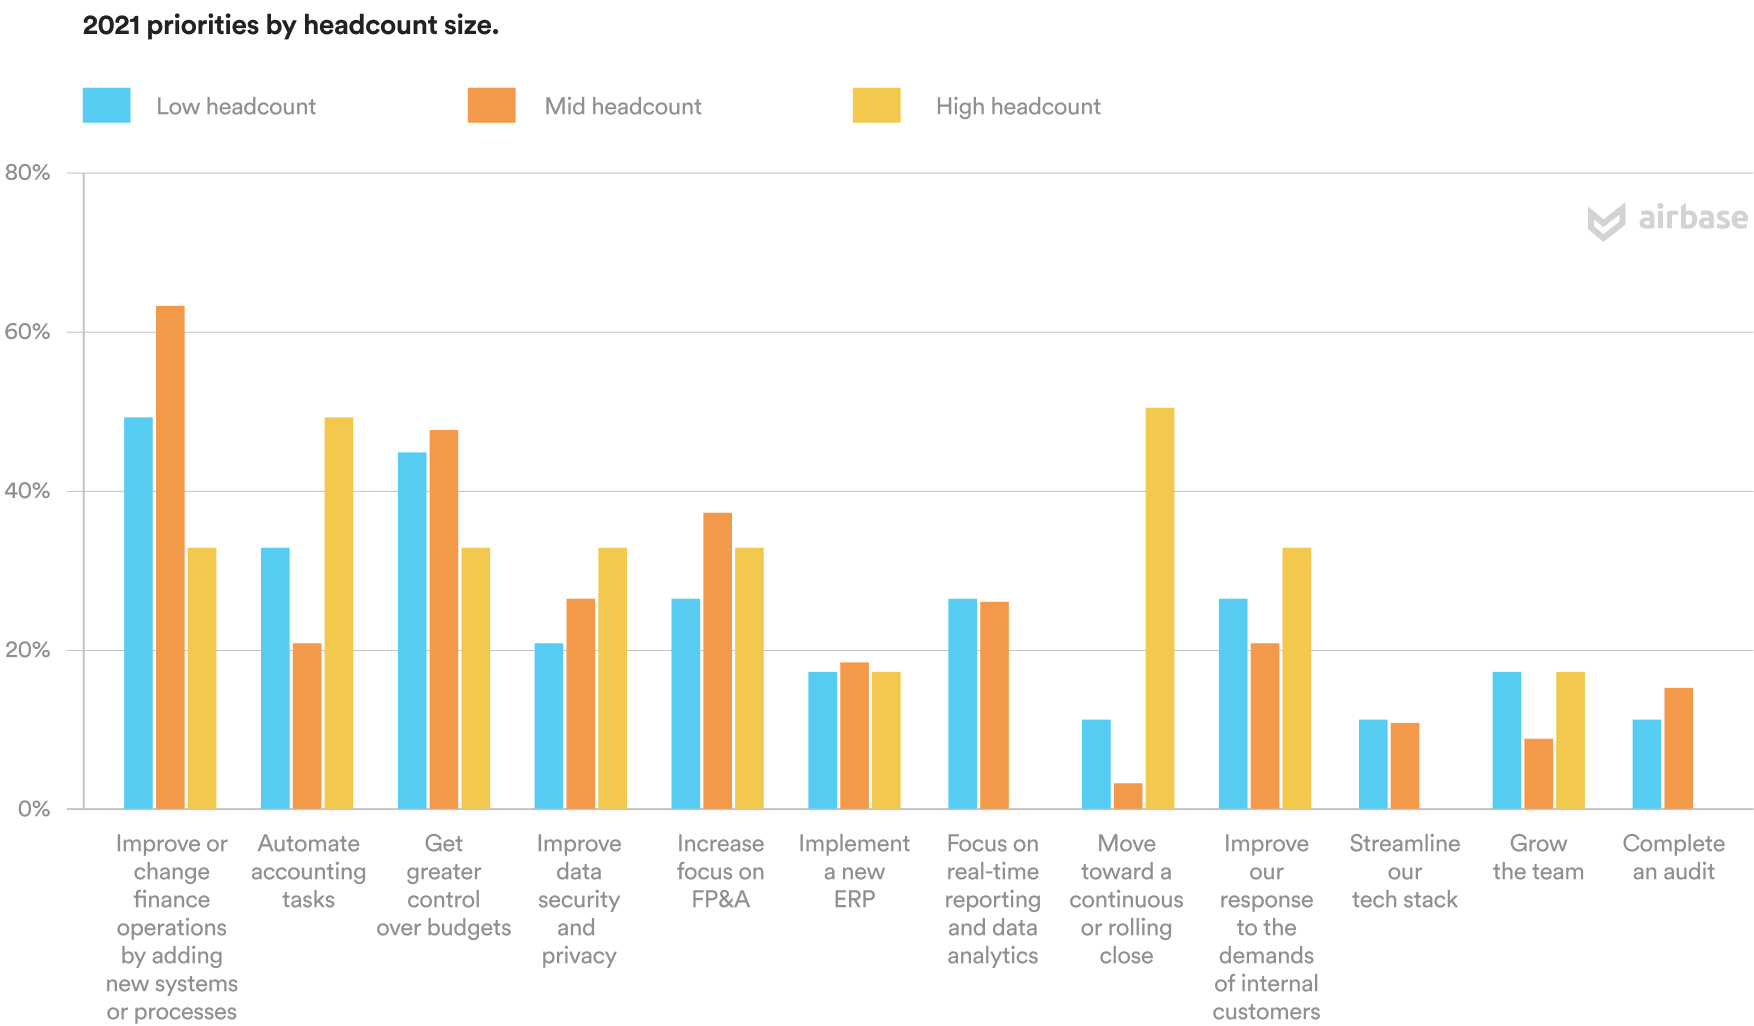
Those surveyed were asked to select their top priorities going into 2021. The most common response was “to improve or change finance operations by adding new systems or processes.” Notably, though, mid headcount companies were twice as likely as high headcount companies to answer this way. Getting control of budgets ranked as a close second priority.
Also worth noting, in a demonstration of forward-looking strategy from one of our cohorts, high headcount companies report prioritizing a move to a continuous close.
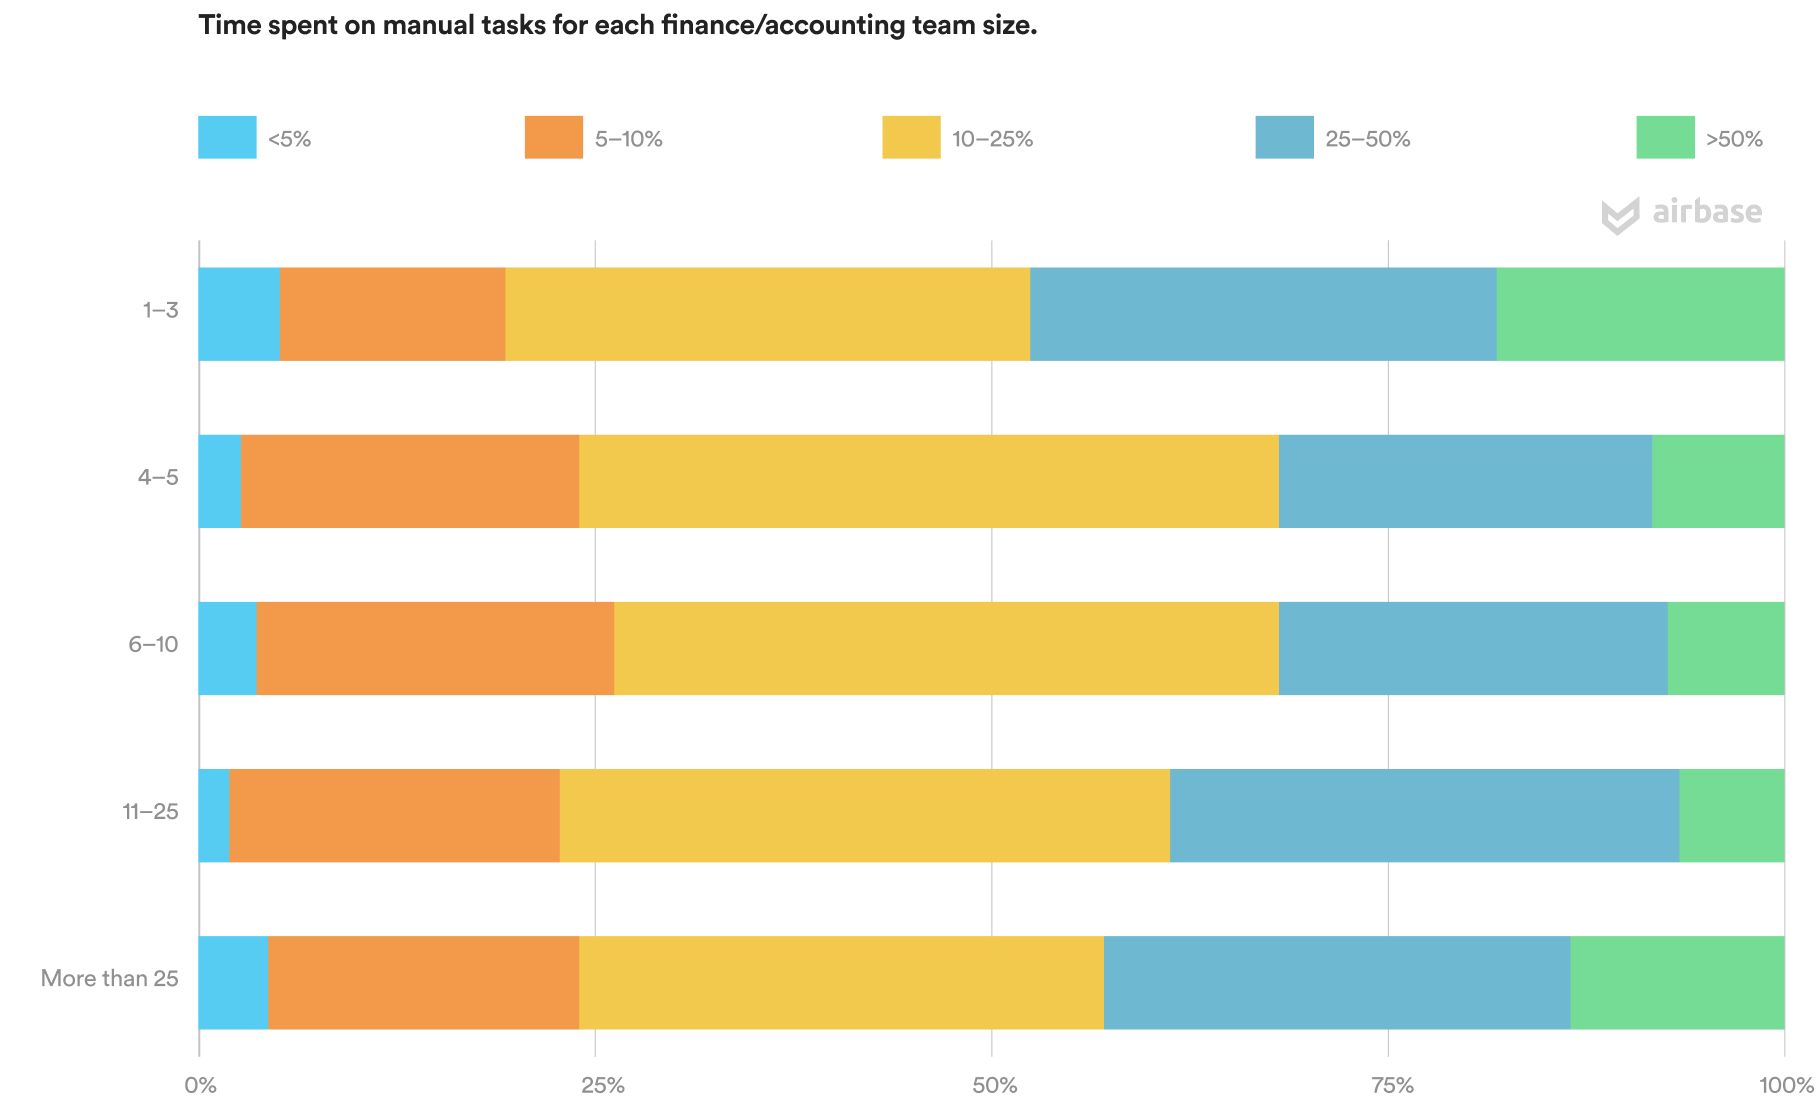
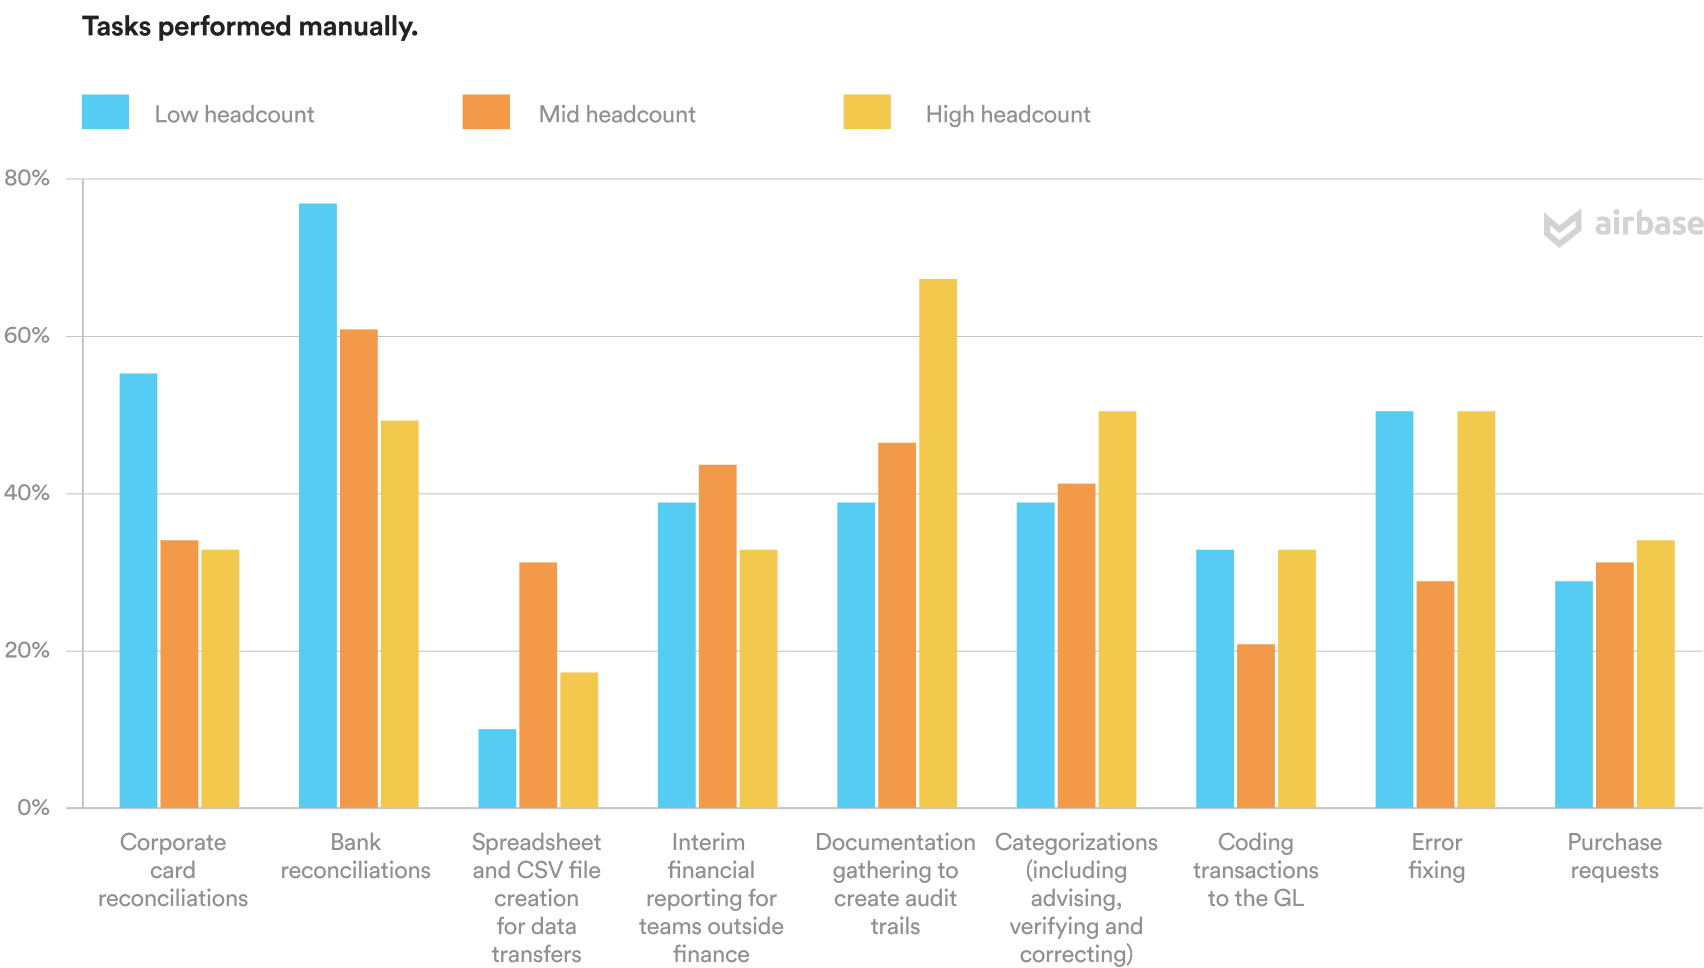
The data show that manual tasks are common across all teams. Only a very small minority (3%) reported that the amount of time spent on manual tasks was less than 5% of their team’s total time. And larger finance and accounting teams reported the highest time spent on manual tasks: Nearly half (44%) of respondents from finance and accounting teams of 25 or more say that they spend a quarter or more of their time on manual tasks.
A closer look at these manual tasks reveals that they’re evenly spread over a variety of operational areas, from document chasing to error fixing, to handling credit card statements. Bank reconciliations, though, were most frequently reported as being done manually, according to roughly two in three respondents.
The second most highly reported manual task was “documentation gathering to create audit trails.” Only the most modern finance automation tools include the automatic creation of full audit trails, so it is not surprising to see it on the list.
Outsourcing.
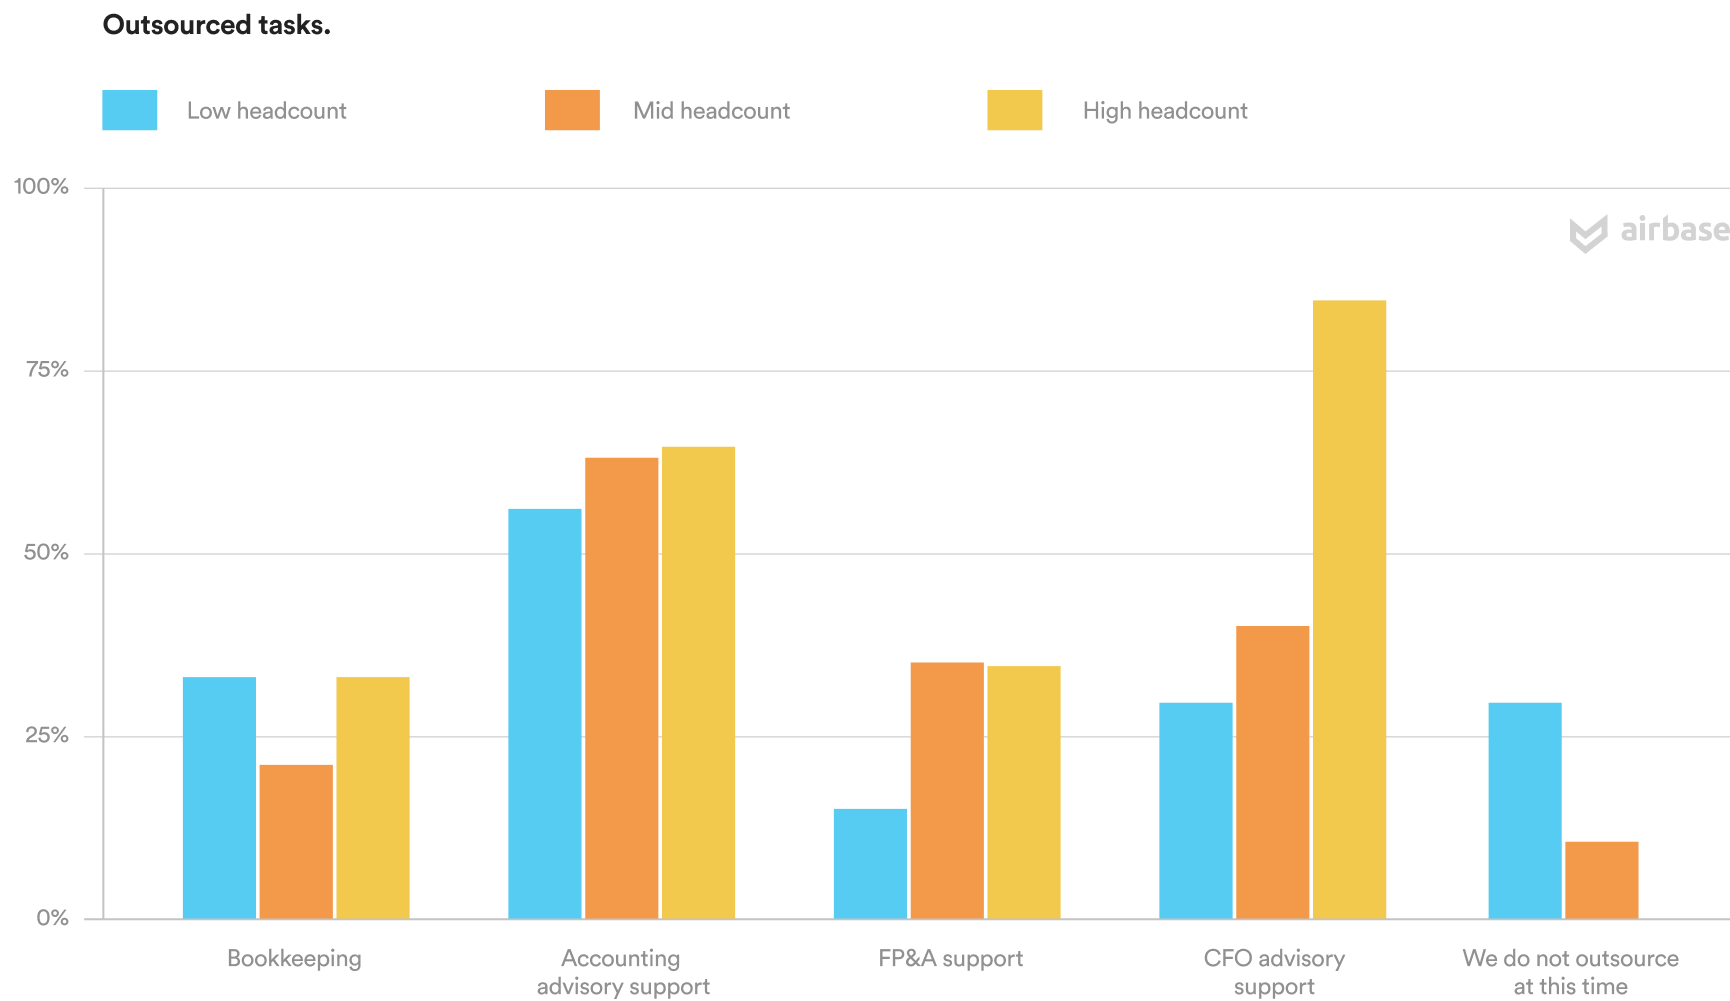
All high headcount companies outsource some of their accounting and finance work, and most companies report doing bookkeeping internally.
Small and midsize businesses tend to outsource some of their finance and accounting functions, so we asked respondents to indicate where they did so. The choices we gave ranged from bookkeeping to CFO support.
Accounting advisory topped the list, with roughly half of respondents indicating that they outsource for it, and only about a quarter of respondents reported using outsourced bookkeeping.
Time-to-close.
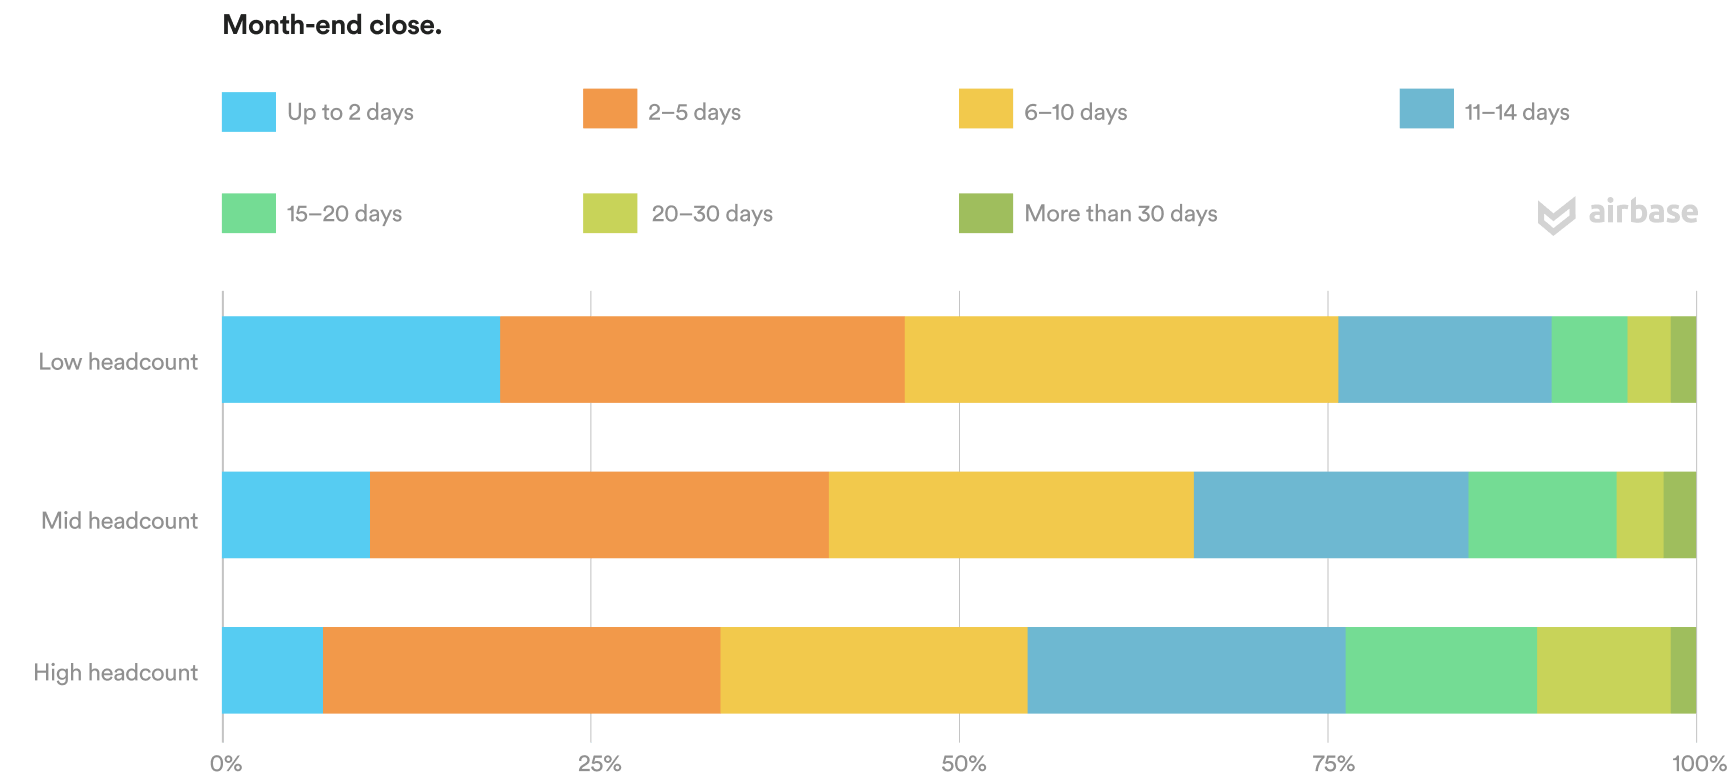
Month-end and year-end closes are impacted by the high levels of manual work. We found that 61% of respondents spend more than a week on their month-end close, and 18% spend more than two weeks, with responses ranging from two days to more than 30 days.
It’s reasonable to surmise that further automation of manual tasks, especially when automation is integrated directly to the GL so that it doesn’t create extra work to close the books, can help to shorten these timeframes.
04 
Financial tech stack.
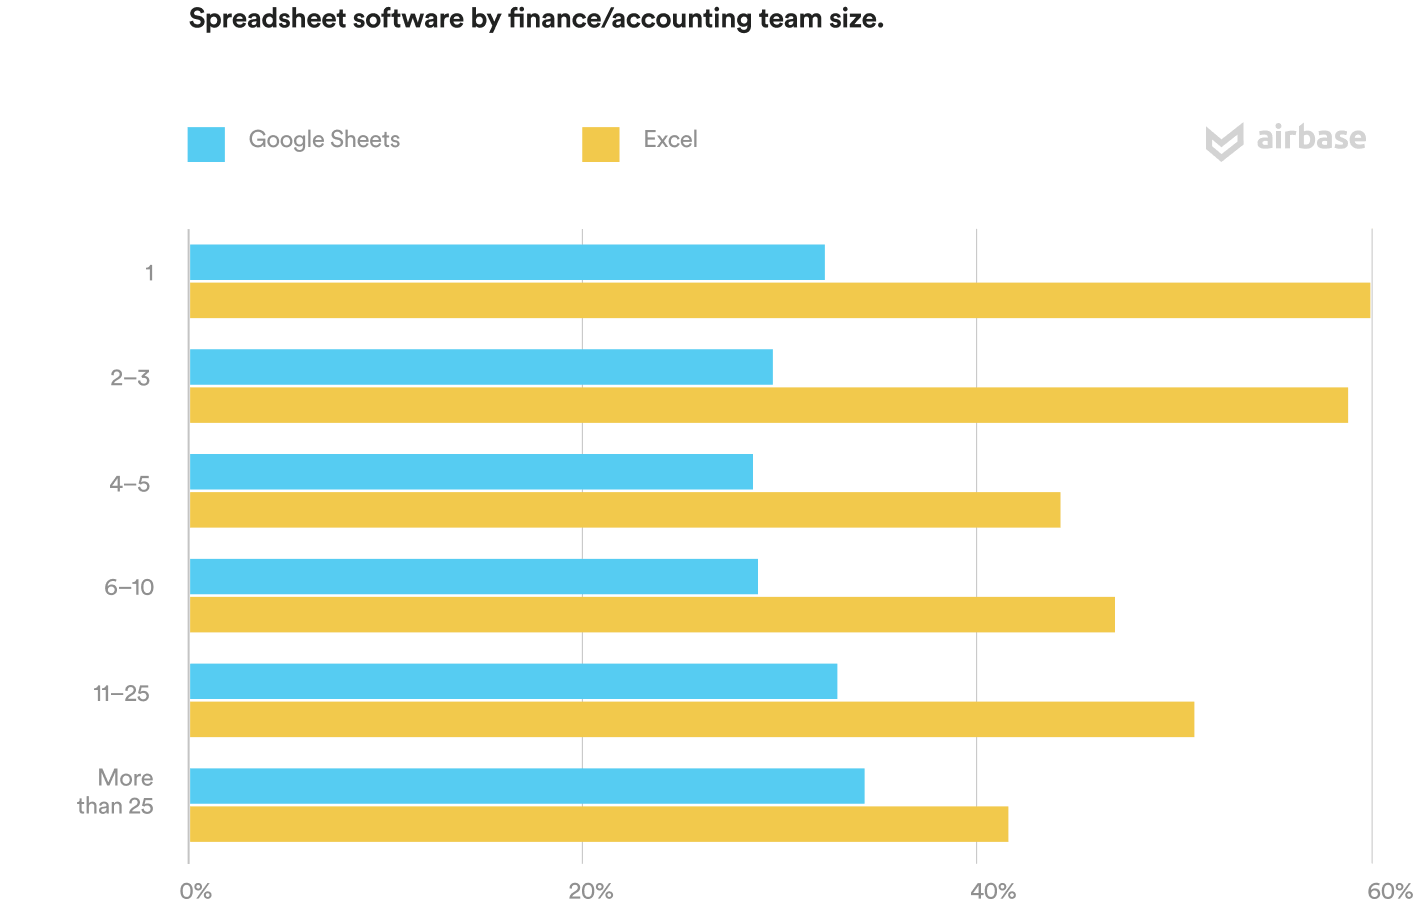
We asked respondents to identify applications in their teams’ tech stacks from a list that we provided. While a majority rely on accounting software for their GL, a minority of respondents report using expense management, bill payment, or spend management software.
In general, low headcount companies reported much higher use of newer software solutions, while high headcount companies were more likely to use legacy tech, suggesting that these smaller companies are more agile in adopting tools to meet their needs.
Modern CFOs take on broader operational roles than their predecessors: project management, systems implementation, M&A, data analytics, IT.
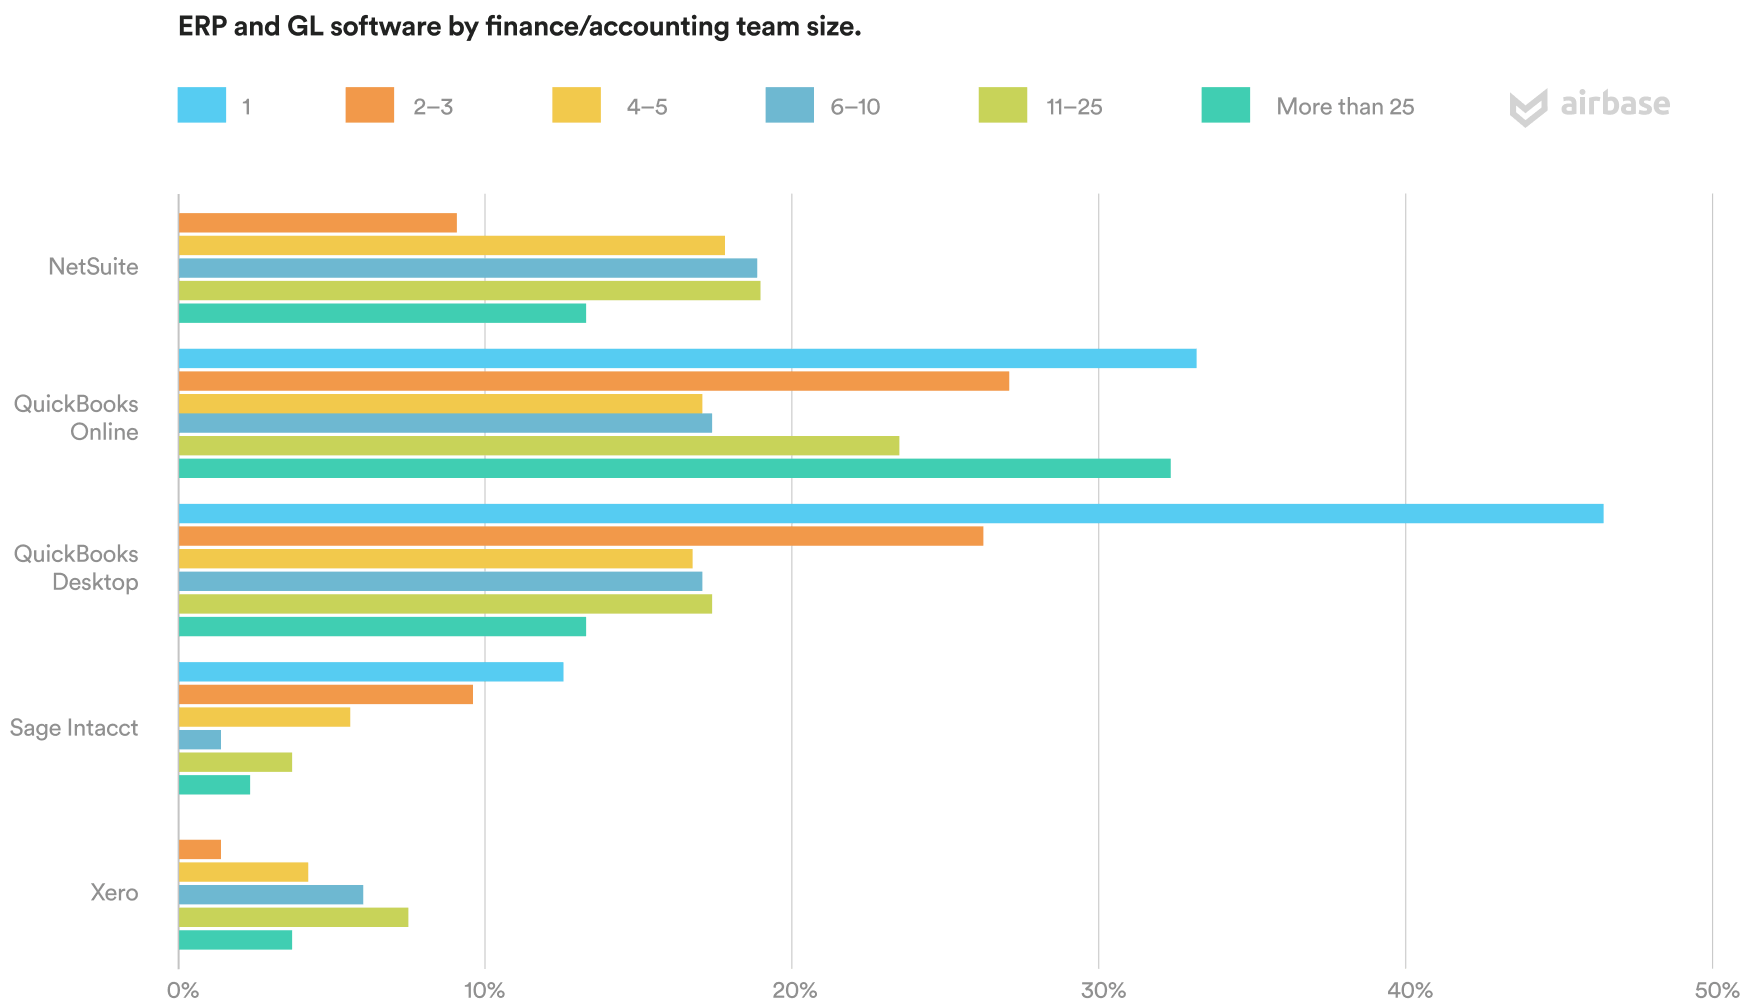
Dominance of the main accounting software companies (Oracle NetSuite, QuickBooks, Sage Intacct, Xero) was reflected in our pool, with roughly four in five respondents using one of these as their General Ledger. You can see the reporting in the table below.
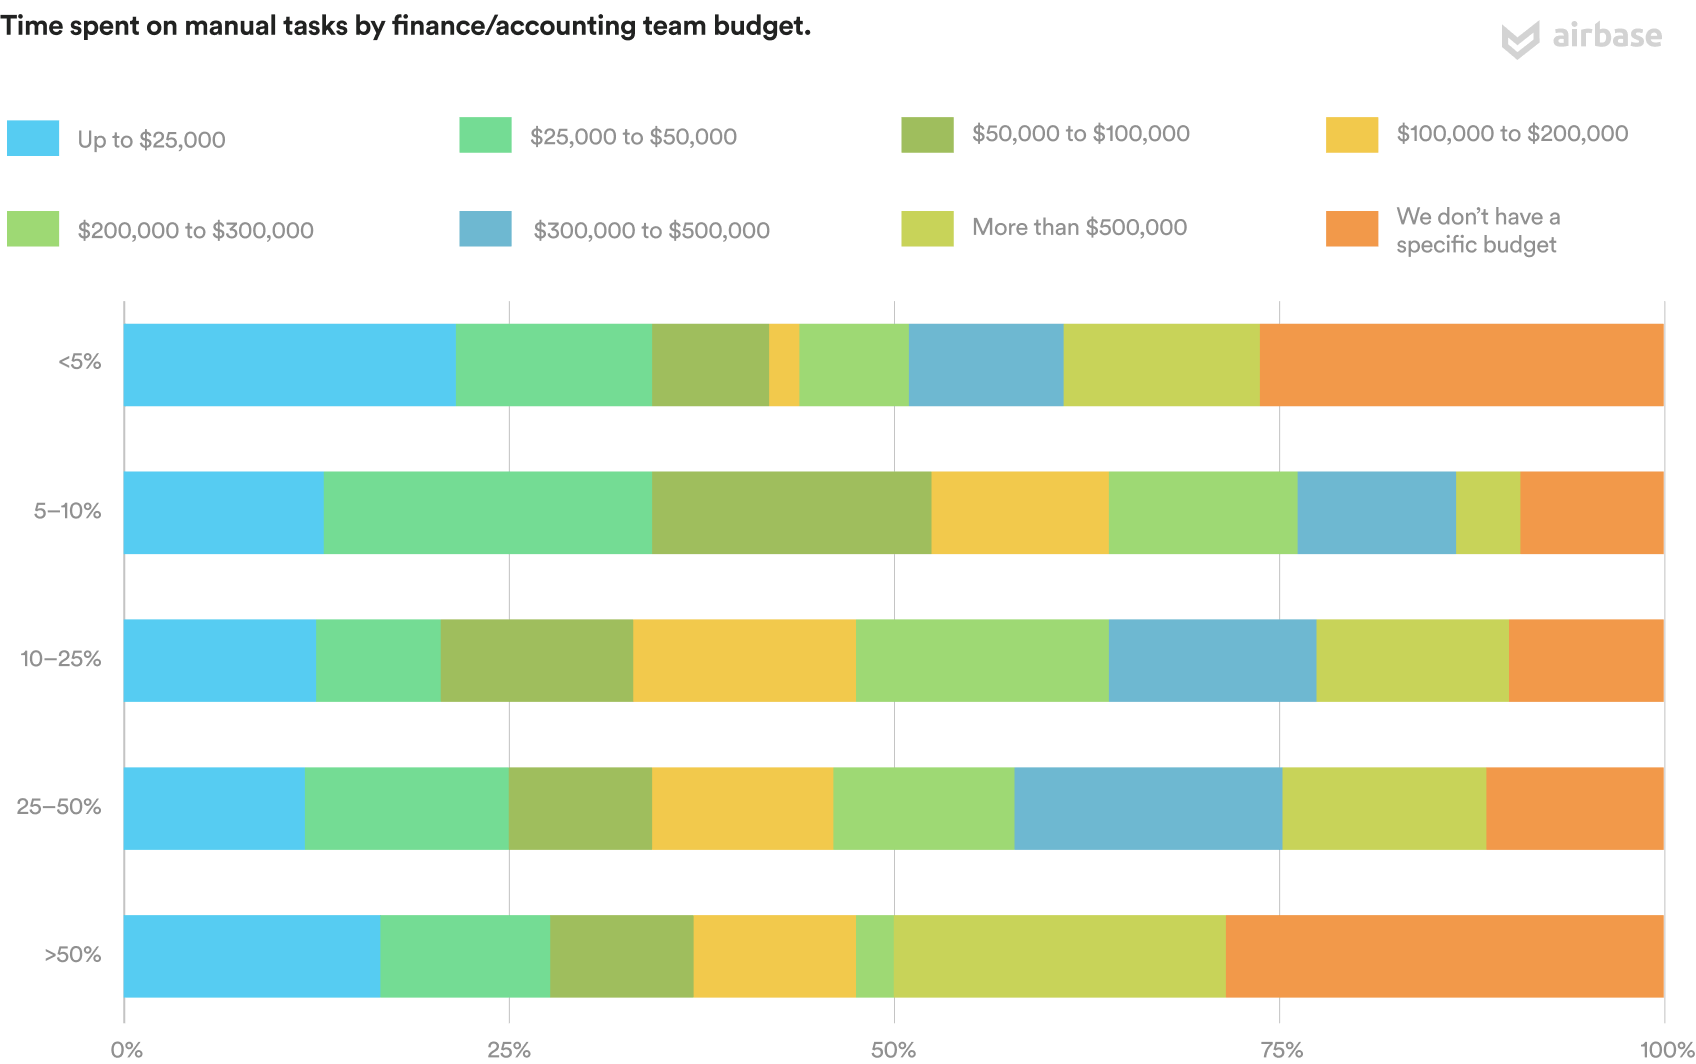
Software budgets for finance teams did not track exactly with the size of their companies, with mid and high headcount and companies having comparable budgets across different annual revenue ranges.
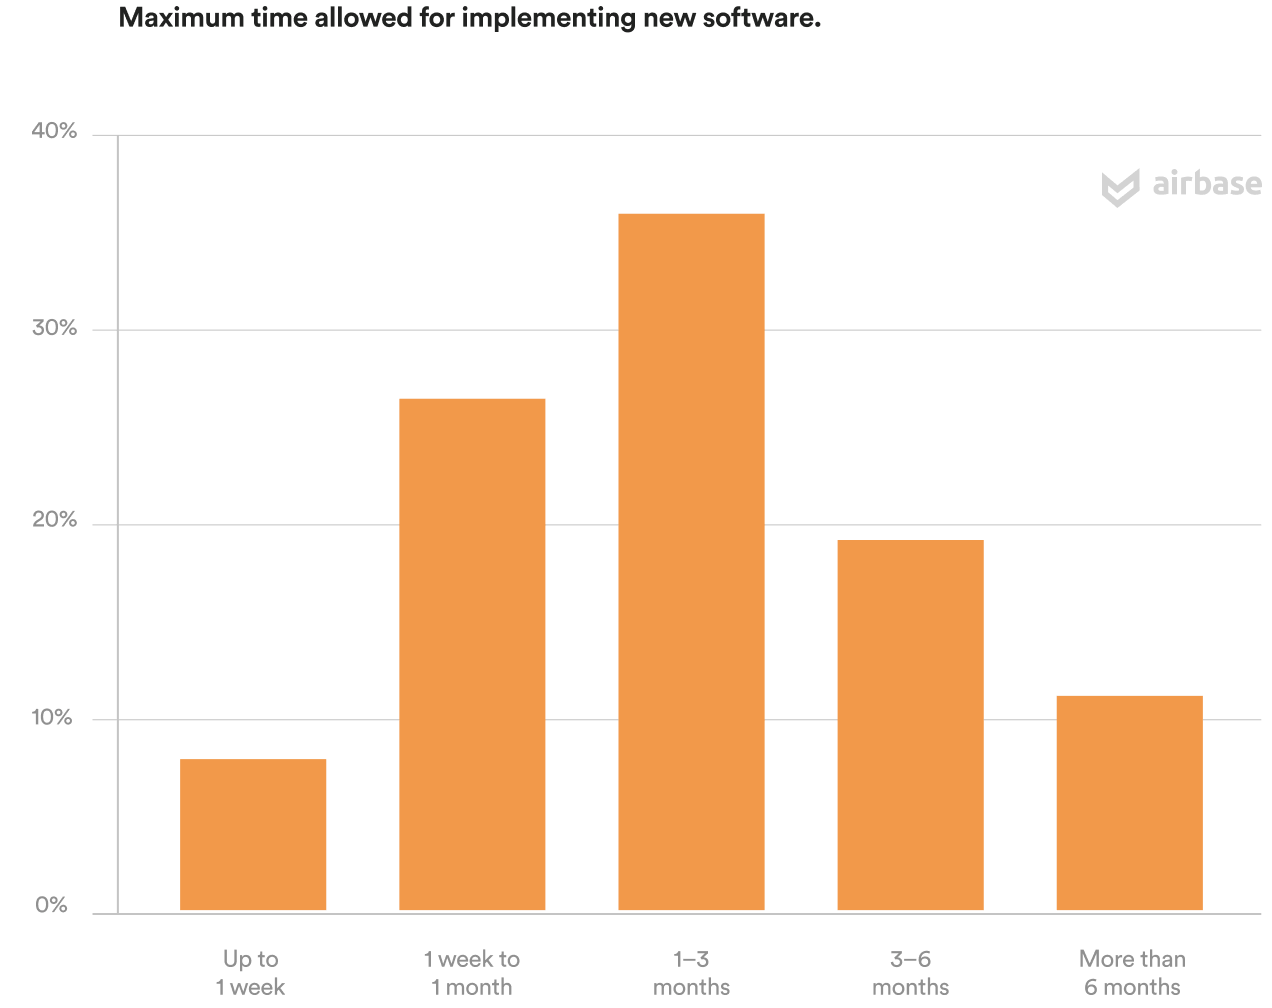
With respect to how much time respondents were willing to spend on implementing new software, except for extensive migrations to new ERPs, the estimates ranged from under a week to more than a year, with the majority in the 1–12 week range.
Visibility and control.
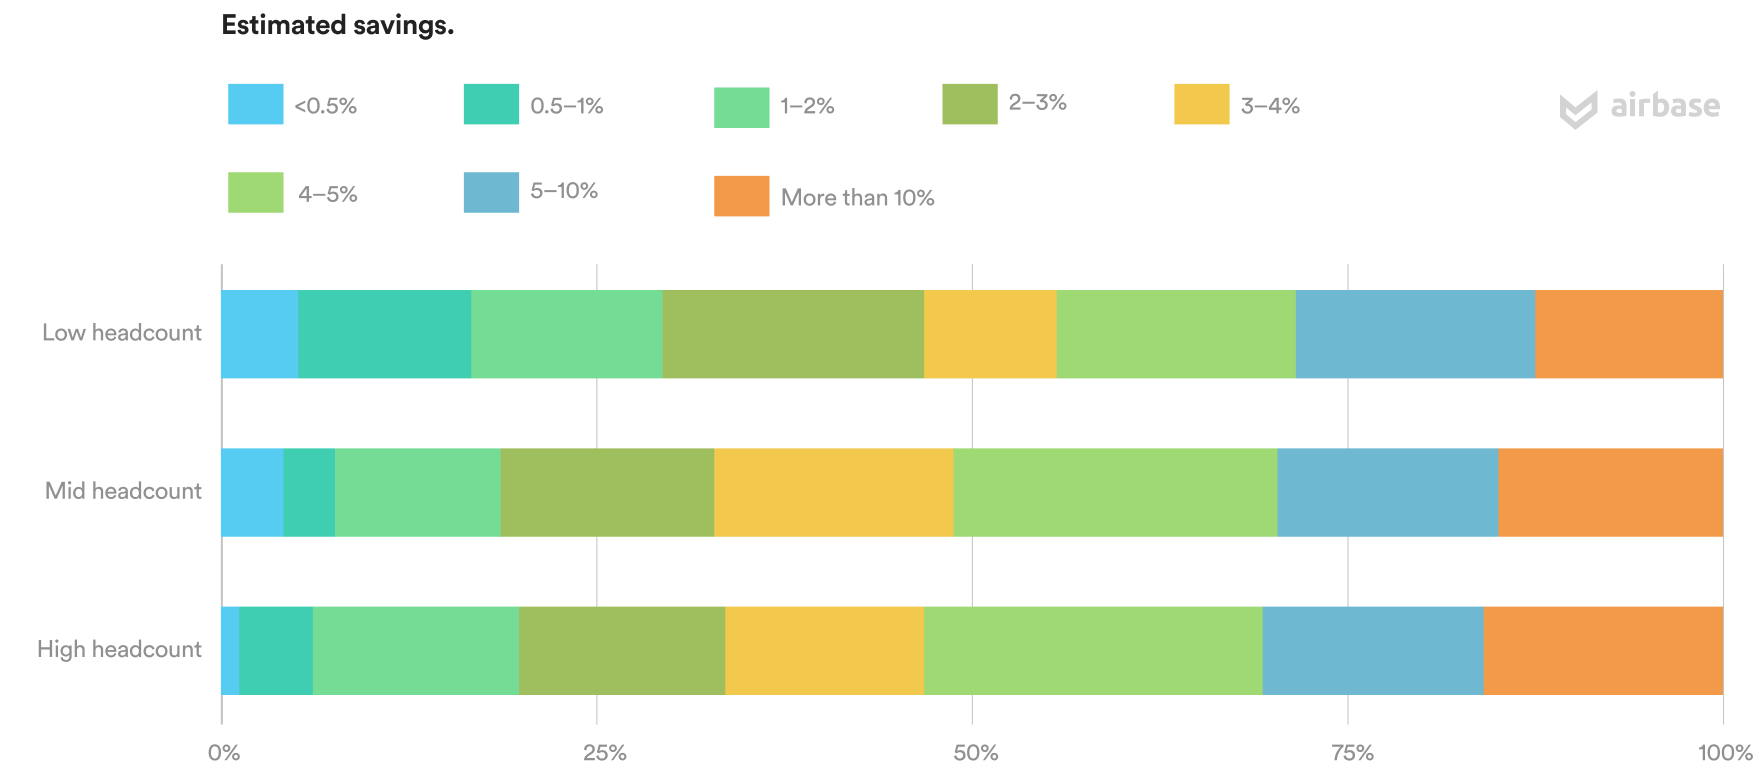
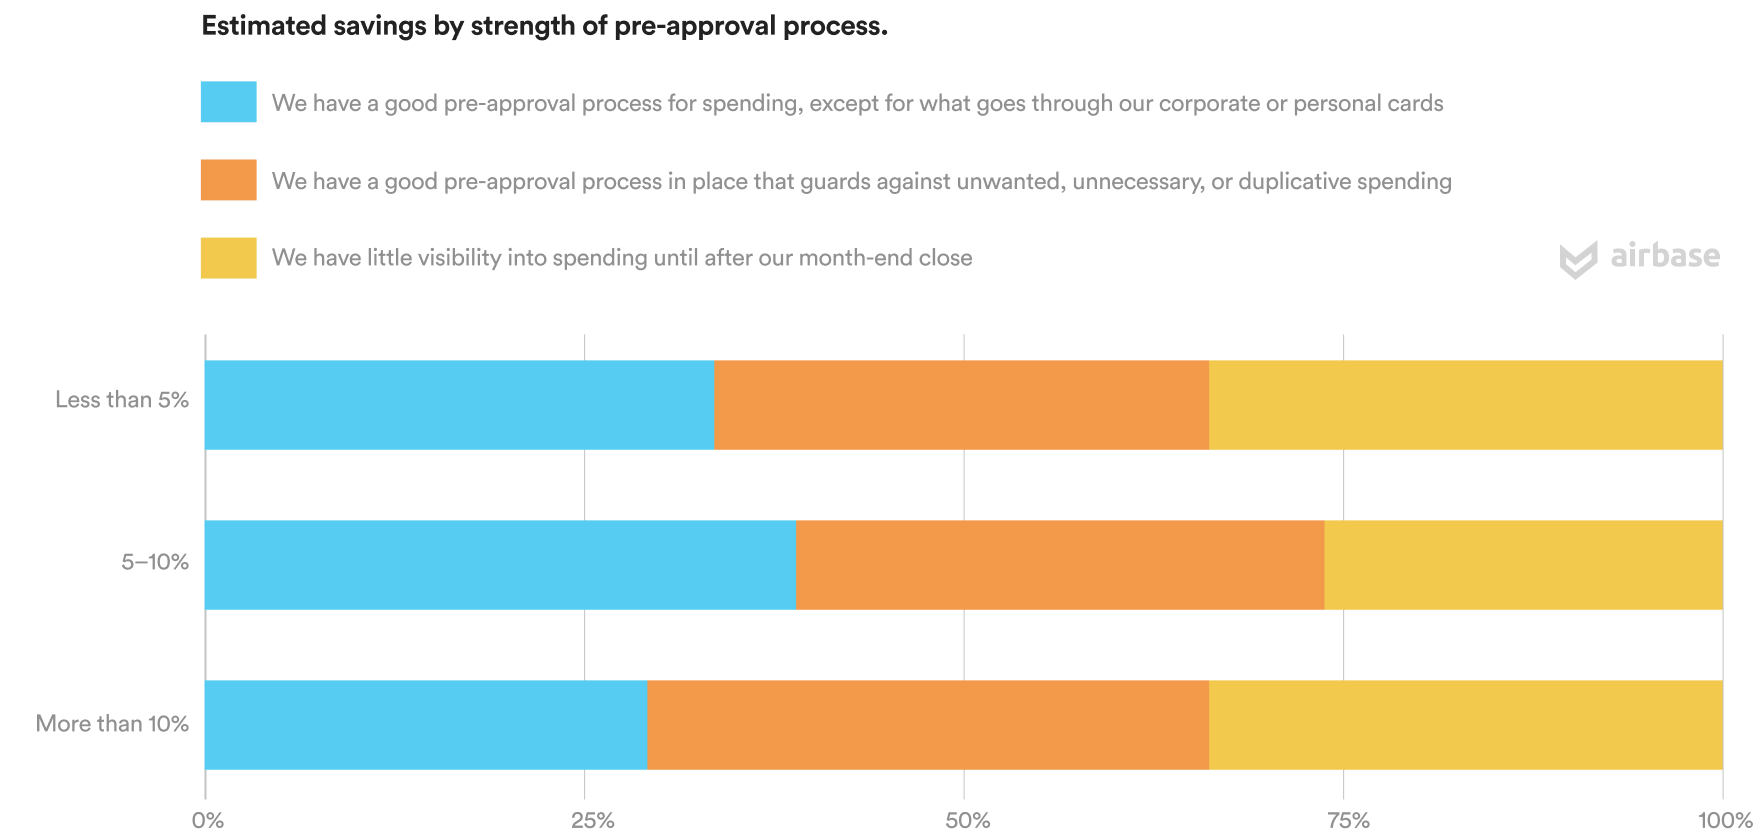
Professionals report high levels of wasted spend, even when they have robust pre-approval spend processes in place.
At Airbase, we know that the insufficient approval workflows associated with employee spending of company dollars can make it difficult to control budgets. We were interested in understanding how much visibility and control finance leaders feel they have over spending and if, with better controls, they could save on wasted spend.
The world is getting more and more complex, and CFOs are going to have to stay on top of it: making sure that you automate, that you have a single source of truth for your data, that you have good infrastructure around data and analytics, and that you can handle this complexity while continuing to bring the real information, not just the data, to the table. — Kelly Battles, former CFO, Quora
At the same time, 41% of respondents reported that they feel they do have visibility into and control of spend before it happens through strong pre-approval processes.
It is perhaps not surprising that respondents from companies with less than $1 million in annual revenue were about half as likely to report concern with visibility into spending, as small companies have an easier time informally knowing who is spending on what.
Looking forward.
The future is automated, sure, but it’s also integrated.
We believe our data reveal that the sustained period of replacing manual tasks with technology will continue as better designed, more integrated solutions, are made available to meet the real needs of accounting and finance teams in small and midsize businesses. Our respondents rank “improving or changing operations by adding new systems or processes” as their highest priority for 2021, followed by “automating accounting tasks” and “getting control over budgets.”
Those that are always forward-leaning tend to prosper, at least in my assessment of patterns.
The large enterprise software solutions that provide comprehensive finance operational and accounting support have generally been too expensive and over-engineered for the smaller companies in our sample. Now, however, there is increasing availability of tools that integrate with GL systems and specifically address laborious back-office tasks: expense reimbursements, vendor payments, corporate card solutions for small and midsize businesses. Given our data, we expect professionals to trend away from siloed tools and toward more integrated solutions, such as Airbase’s spend management platform, to make themselves more available for higher-value analytical work.
As you carry out your own plans to add new systems and processes in 2021, we invite you to schedule a demo with one of Airbase’s spend management specialists. They can show you how Airbase provides fully integrated automation, from the very first action on spend all the way through to the GL. We’ll also show you how all actions for non-payroll spend are captured to create a full audit trail of all internal and external documentation.
 Jira Integration – Streamline Your Workflows
  Ironclad Integration – Simplify Legal Operations
  Asana
Asana 

